As 2015 begins, industry analysts and market strategists have made a number of projections for the S&P 500, including target prices and EPS estimates for individual companies in the index and for the index as a whole. This special Market Insight provides an overview of these predictions for 2015.
S&P 500 Projected to Increase in Value in 2015
After an 11.4% increase in value in 2014, do industry analysts and market strategists believe the S&P 500 will increase in value in 2015? The answer is yes.
Industry analysts in aggregate predict the S&P 500 will see a 6.8% increase in price over the next twelve months. This percentage is based on the difference between the bottom-up target price and the closing price for the index at the end of December. Aggregating the mean target price estimates (based on company-level estimates submitted by industry analysts) for all the companies in the index, the bottomup target price for the S&P 500 is 2198.08, which is 6.8% above the closing price of 2058.90.
Market strategists predict the S&P 500 will see a 3.6% increase in price over the next twelve months. This percentage is based on the difference between the top-down mean target price and the closing price for the index at the end of December. Taking the average of the nine index-level target price estimates submitted to FactSet by market strategists, the top-down mean target price for the S&P 500 is 2133.00, which is 3.6% above the closing price of 2058.90.
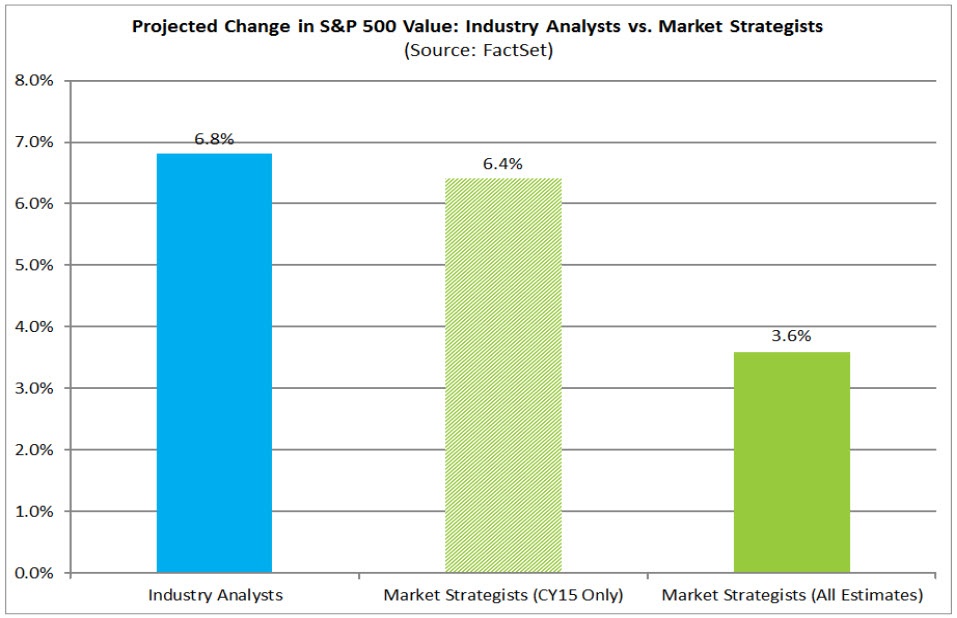
However, the top-down mean target price estimate at the end of December still included some individual target price estimates for 2014. Removing these 2014 estimates (or updating these 2014 estimates to 2015 when applicable), the average of the six index-level target prices for 2015 is 2191.67, which is 6.4% above the closing price of 2058.90. Who will be correct? It is interesting to note that both groups underestimated the closing price of the index for 2014 one-year ago. At the end of 2013, the bottom-up target price was 1937.91, and the topdown mean target price (based only on CY14 estimates submitted by 5 market strategists) was 1910.00. Compared to the closing price of the S&P 500 at the end of 2014 of 2058.90, the industry analysts underestimated the price of the index by 5.9% one year ago, while the market strategists (CY14 only) underestimated the price of the index by 7.8%.
Record-Level Bottom-Up EPS Projected for 2015
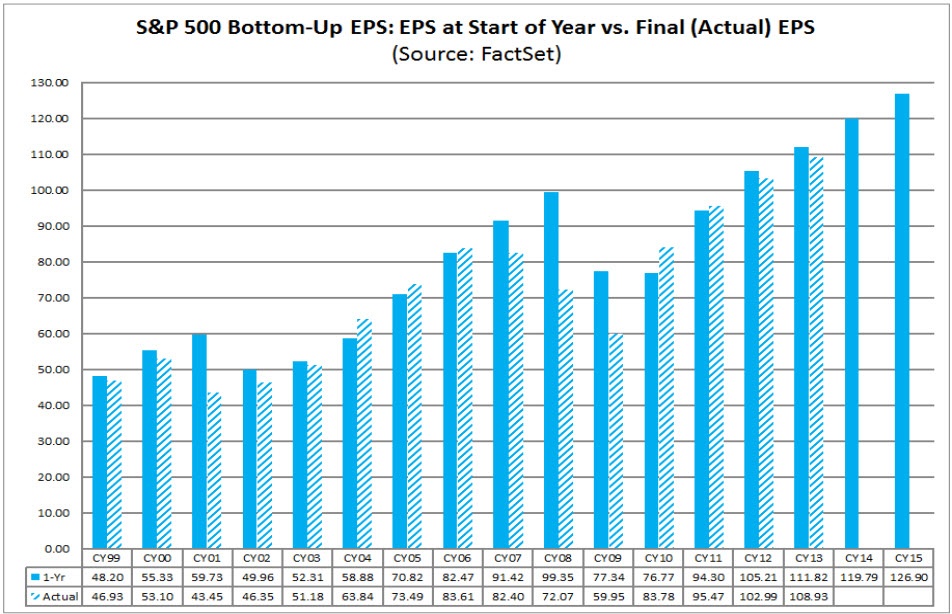
For 2015, the bottom-up EPS estimate (which reflects an aggregation of the EPS estimates for all 500 companies in the index) on December 31 was $126.90. If $126.90 is the final number for the year, it will mark a new record-high EPS number for the index. However, what is the likelihood that $126.90 will be the final EPS value for the S&P 500 in 2015? How accurate is the bottom-up EPS estimate one year in advance?
Over the past 15 years, the average difference between the bottom-up EPS estimate at the beginning of the year and the final EPS number for that same year has been +7.6%. In other words, industry analysts on average have overestimated the final EPS number by about 7.6% one year in advance. Analysts overestimated the final value (i.e. the final value finished below the estimate) in ten of the fifteen years and underestimated the final value (i.e. the final value finished above the estimate) in the other five years. For the purposes of this analysis, the final EPS number for a year is the EPS number recorded two months after the end of each calendar year (February 28) to capture the actual annual EPS results reported by most companies during the fourth quarter earnings season.
However, this 7.6% average includes three years in which there were substantial differences between the bottom-up EPS estimate at the start of the year and the final EPS number: 2001 (+37.4%), 2008 (+37.8%), and 2009 (+29.0%). If these three years are excluded, the average difference between the bottom-up EPS estimate one year prior to the end of that year and the final EPS number for that year has only been +0.9% over the past 15 years.
If one applies the overall average overestimation of 7.6% to the 2015 EPS estimate, the final value for 2015 would be $117.20. If one applies the average overestimation of 0.9% excluding the years 2001, 2008, and 2009, the final value for 2015 would be $125.81.
Full 2015 Projections
- Highest forward 12-Month P/E ratio since 2005
- The nine sectors predicted to report Earnings and Sales growth in 2015
- Which two sectors have the highest percentage of buy ratings
- The top five most recommended buys in the S&P 500
- Which companies had the highest and lowest target prices vs closing price
- The companies with the highest percentage of sell ratings


Insight/Author%20Bios/JohnButters2.jpg)
